
Today’s post, the fourth in this series on the history of image display in MATLAB, makes one final stop in the early 1990s before getting to the 1997 MATLAB 5 release that profoundly affected everything about image processing in MATLAB. I want to explain why I was so bothered by the way image display worked in version 1 of Image Processing Toolbox. Do you remember my beta feedback, shown in the previous post in this series?
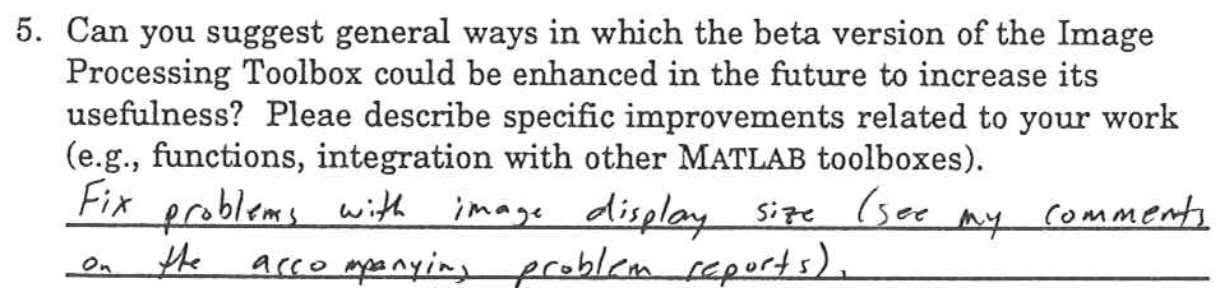
Excerpt from Steve Eddins beta program survey form, Image Processing Toolbox version 1.0 beta, 1993
Shrinking Images
When I received the Image Processing Toolbox 1.0 beta release in summer 1993, I had been doing research in image processing for 7 years, including grad school and my faculty job. For most of that research, I programmed in C and displayed images using tools such as xv on X Window workstations such as the Sun SPARCstation. In that time, I never saw anything like what imshow did in that first toolbox version.
It shrunk most images, causing them to be distorted because of missing pixels.
Every other image display tool that I had used would display images at 100% magnification, with one image pixel per screen pixel. (At the time, because of the very limited memory of computers then, it was rare to have more image pixels than screen pixels.)
Consistency with Standard MATLAB Graphics Behavior
Why did imshow shrink most images for display? Well, the developers who created it were simply matching the standard behavior of the graphics system (“Handle Graphics”) that was introduced in 1990 in MATLAB 4. When you called a high-level graphics function, the standard behavior was to plot it into the current axes of the current MATLAB figure. If there wasn’t a figure already on the screen, one would be created automatically, with a default size. An axes object would also be created automatically, with a default size.
Consider a computer monitor with 800 x 600 pixels. The default figure size at the time was half of the screen size in each dimension, or 400 x 300 pixels. The default axes size was 3/4 of the figure size horizontally, and 2/3 vertically. This left space for tick labels, axes labels, and a title. The available plot box space, then, was only 300 x 200 pixels.
That’s … not very many pixels.
Suppose you have a 512 x 512 image. You just can’t display that into a 300 x 200 box without leaving out a bunch of image pixels.
Simulating the Early 1990s MATLAB Figure Size
When I tried to explain this history to MATLAB graphics developers and Image Processing Toolbox developers in the 2020s, I initially found it difficult to get my point across. Ultimately, I solved the problem by writing some code to simulate, on a modern screen, what an image would have looked like on an early 1990s computer monitor using MATLAB 4 and imshow.
Here is an example. This image is the output of an edge detector. The particular edge detector that I used is guaranteed to produce closed-contour edges.
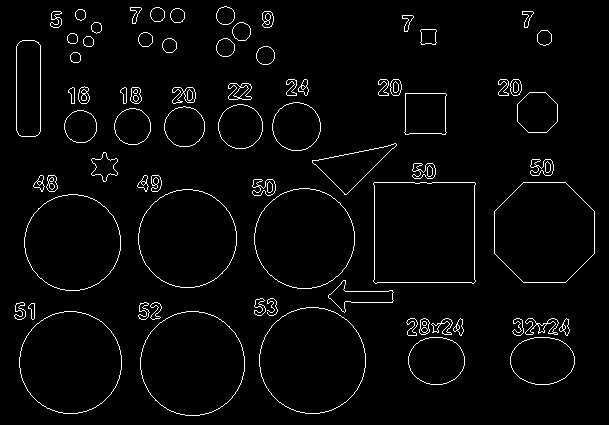
Edge detection result for sample 609 x 425 image.
The image size, 609 x 425, was large but manageable for that time. It was small enough to fit on a 800 x 600 computer monitor, and the xv app would have shown it as it appears above. However, it was too big to fit in the default axes on a default figure.
Here is a simulation showing what the displayed image would have looked like following a call to imshow in version 1 of the toolbox. The gray rectangle is roughly comparable to the physical size of the MATLAB figure as it would have appeared on a 800 x 600 21" monitor. (For best results, view this on a laptop or desktop computer, as opposed to a phone or other small device.)

This image display result was not acceptable.
The TRUESIZE Function
As a work-around for the image display size problem, version 1 of Image Processing Toolbox also introduced the truesize function. This function would resize the figure, enlarging it from its default size so that (ideally) there would be exactly one image pixel per screen pixel. Although that ideal wasn’t always met, because of floating-point rounding in coordinate system calculations associated with the axes Units and Position properties, the resulting display was a big improvement.
Usually, truesize would be called immediately after imshow, like this:
imshow(A)
truesize
Confusion and Complaints
The truesize function helped, but many people either did not discover it or did not realize its importance. In my first few years at MathWorks, I encountered many cases of user confusion and complaint about image display in MATLAB.
One such case sticks out the most in my mind. When I was in the MathWorks vendor booth at a professional conference, a close relative of the MathWorks CEO, Jack Little, approached and introduced herself to me. She had questions about image processing in MATLAB. An image processing algorithm that was supposed to produce connected contours was instead producing broken contours, and she wondered if she was doing something wrong, or if there was something wrong with the algorithm.
I had to explain that the problem was likely with the image display, not the image processing algorithm, and I recommended that she use truesize in combination with imshow.
Next Stop: 1997
The MATLAB 5 release, in early 1997, was a major event in the history of MATLAB. Without it, we wouldn’t be talking now, almost 29 years later, about image processing in MATLAB. Next time, I’ll explain how MATLAB 5 and Image Processing Toolbox version 2 affected image display in MATLAB. I’ll also explained what happened at that time with imshow and truesize and image display size.