
It must seem weird that I am posting about IMVIEW v4 (File Exchange link, GitHub link) already, when it was just 2.5 months ago that I posted about v3. But two things have happened since then that prompted me to prepare a new release. First, the ancient, do-nothing, Image Processing Toolbox placeholder function imview was removed. This is important because that name conflict prevented the installation of the toolbox file (.mltbx) for this package from working correctly. Second, some discussion on the File Exchange caused me to rethink the implementation of the zoom-level display field.
After a period of contemplation, I decided that I would now “require” R2026a, but I would also provide information on how to get imview to work with earlier releases by manually fixing up the MATLAB search path. And, to improve the positioning of the zoom-level display, I decided to change the type of object used for it. These two changes have compatibility impacts, and that’s why I’m bumping the version to 4.0.
The biggest recent change, in v3, is that the dynamic, zoom-related behaviors of imview now work in the Live Editor.
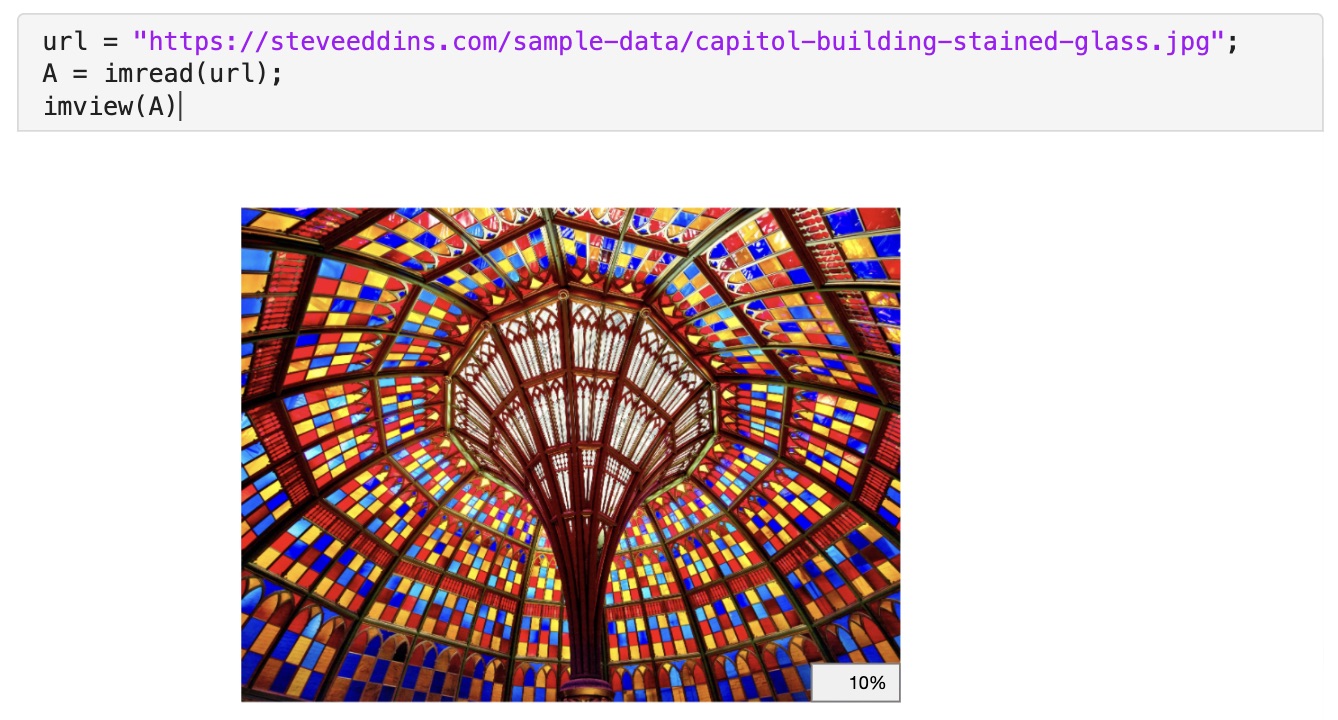
Screenshot of imview in the Live Editor. (image credit)
In the rest of this post, I’ll recap the purpose of imview and then summarize the recent changes (v3 and v4).
Overview of IMVIEW
I created imview to overcome some of the limitations of the MATLAB image display function imshow. These limitations include:
- Glitchy behavior related to
imshowchanging the figure size - Poor quality interpolation by default
- Poor zoom behavior for “skinny” tall or wide images
Additional features of imview include:
- Adaptive interpolation method (by default)
- Display of the magnification level (which can be shown or hidden using an axes toolbar button)
- A pixel grid overlay that appears automatically when individual pixels get very large on the screen
Changes in IMVIEW v3
Now version 3 is available. Here are the important changes:
- Supports use within the Live Editor.
- Adjusted some thresholds for dynamic behavior:
- The
adaptiveinterpolation method now switches from bilinear to nearest when the pixels are approximately 1/16 inch wide, instead of 1/4 inch. - The pixel grid is now shown when pixels are approximately 3/8 inch wide, instead of 1/4 inch.
- These thresholds can be changed by the user via the settings
imview.AdaptiveInterpolationThresholdandimview.PixelGridThreshold.
- The
- The zoom-level display percentage is now rounded to a value that is appropriate to screen display precision.
- Zooming in on “skinny” tall or wide images now uses all of the available space in the plotting region. (bug fix)
- The File Exchange submissions Pixel Grid and Image Zoom Level and Pan Utilities are no longer required.
Changes in IMVIEW v4
- MATLAB R2026a or later is now required. See below for hints about using
imviewin earlier MATLAB releases. - The word “fit” can be typed in the zoom-level display field to show all of the image in the axes.
- The zoom-level display now stays in place during interactive zooming and panning using a scroll wheel or track.
- Axes limits no longer automatically change to accommodate the extent of additional graphics objects plotted into the axes. (Code in previous releases that attempted to make this work was not reliable.) To change the limits after the image and other graphics objects have been plotted, use
axis auto.
Live Editor Support
Live Editor supports means that imview is now aware of the image size as it is being displayed in the editor, and so it can show the zoom magnification level accurately. For example, in this screenshot, the image is smaller because it is being displayed on the right, instead of being displayed inline. That is why the zoom magnification level is shown as 5% instead of 10% in the screenshot up above.
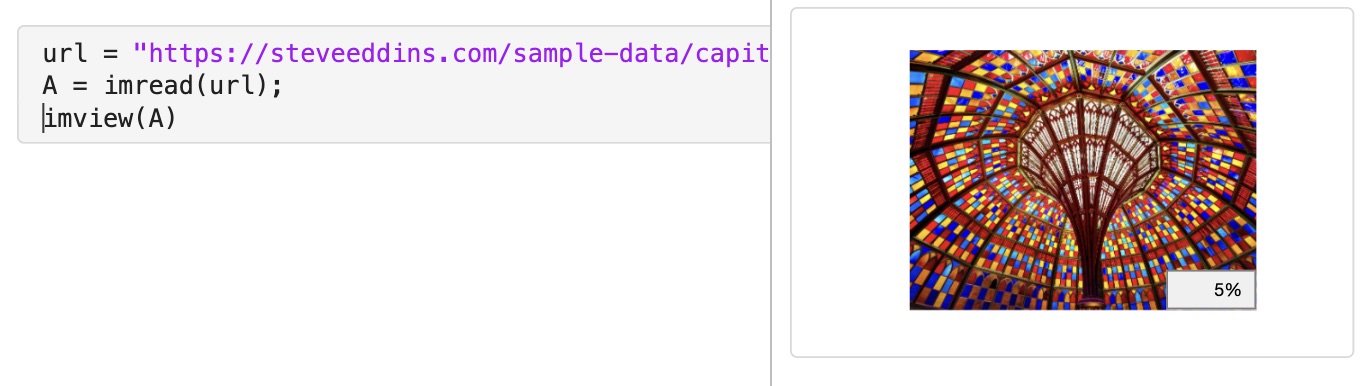
MATLAB graphics being displayed to the right instead of inline.
The function imview can also respond to interactive zooming in the Live Editor. It will automatically switch over to nearest neighbor interpolation when the pixels get large enough to be seen as individual squares. At higher zooms, when individual pixels are even larger, a grid of pixel edges will automatically show.
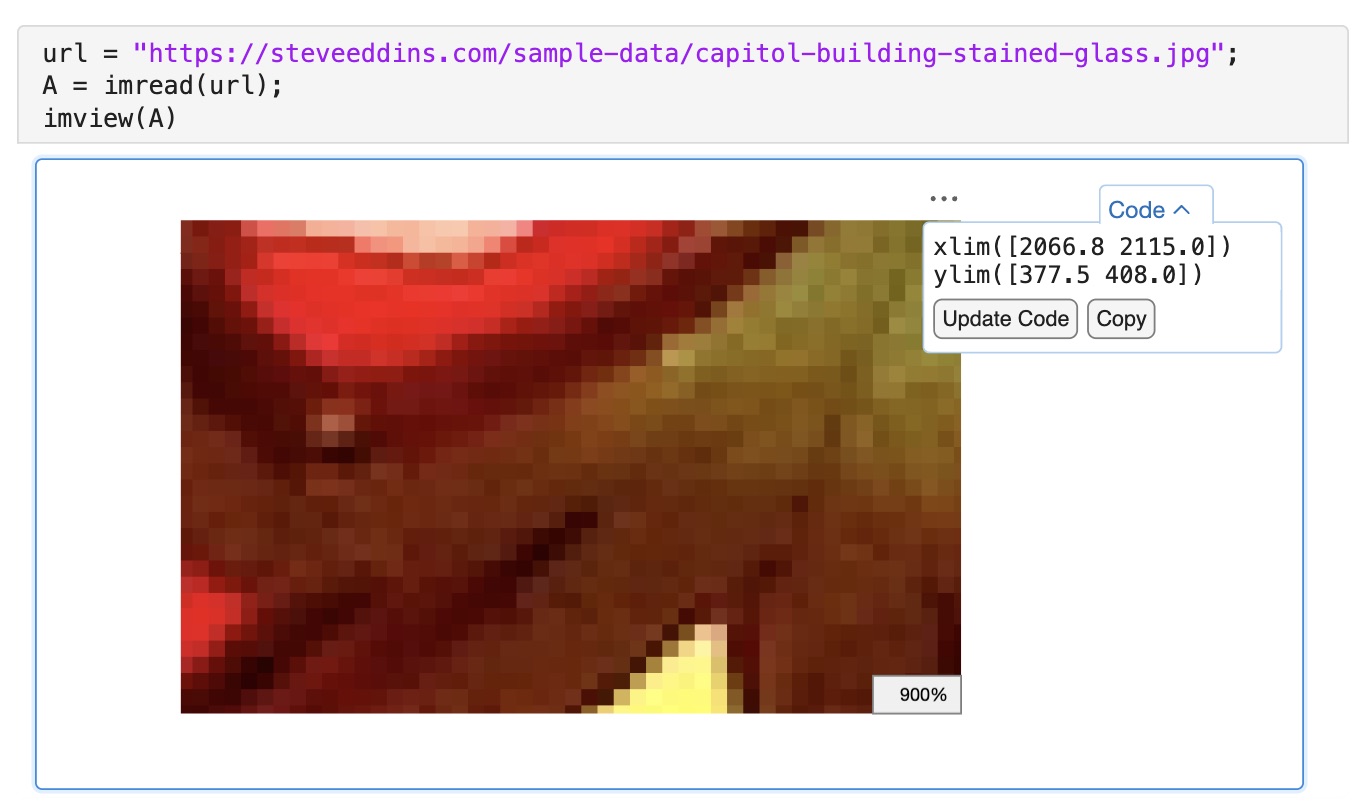
Automatic switching to nearest-neighbor interpolation when individual pixels become visible.
Automatic display of pixel grid overlay when individual pixels become even larger.
I want to note that implementing Live Editor support for imview was a nightmare. It took me many, many hours to figure out how to work around undocumented editor behaviors and limitations. I hope that MathWorks can work out a new architectural path for managing figures in the editor so that custom-written graphics functions with dynamic behavior can be implemented in a more straightforward manner.
Using IMVIEW in Earlier Releases
With R2026a, you can download the toolbox file (.mltbx) from the File Exchange or from GitHub and open it directly to install it, or you can use the Add-Ons Manager.
It is possible to use imview in earlier MATLAB releases, back as far as R2022b, but it requires additional steps if you happen to have the Image Processing Toolbox installed. In R2025b and earlier, that product has a do-nothing placeholder function that is also called imview, and this placeholder function will prevent your installation of this package from working. To fix it, you will need to manually modify the MATLAB search path so that toolbox/imview is at or near the top, above all the MathWorks product folders. See the MATLAB documentation for more information about the MATLAB search path.
I’d like to thank the Image Processing Toolbox team for removing the placeholder function, as it was no longer needed in that product.
You do not need to create an account to leave a comment. Instead, just sign in using your email address or a GitHub account. Please be polite and respectful to all. Comments may be deleted or blocked by the site moderator for any reason. Email addresses are not published or saved. Personal information is not tracked.